
In my last post, I outlined an experiment to predict the S&P 500 index using past price and volume history. In this post, I will present the results of that experiment.
The experimental approach is illustrated in the following diagram:
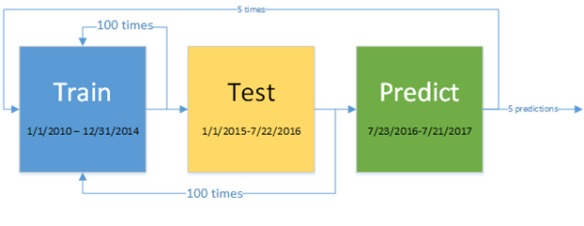
Training is done for 100 generations for the period 1/1/2010 through 12/31/2014. The best program found at the end of training is run over a test prediction range on the period 1/1/2015 through 7/22/2016. The testing performance of each run is stored for later comparison. This test is run 100 times, so 100 programs are tested over the testing range. Each test run includes 100 generations of training. The best performing out of 100 programs in the testing phase is used for actual prediction on the period 7/32/2016 through 7/21/2017. A single generation of training is performed after each prediction.
The above sequence was run 5 times, resulting in 5 separate predictions. The table below provides the additional relevant parameters used in the experiment.
| Predictors | *SP500.m250.1 *SP500_VOL.m250.1 |
| Population Size | 100 |
| Training Generations | 100 |
| Testing Generations | 100 |
| Prediction Step | 1 |
| Prediction Generations | 1 |
| Max Initial Tree Depth | 4 |
| Max Tree Depth | 8 |
| Max Tree Size | 100 |
| Mutation % | 8 |
| Crossover % | 87 |
| Tournament Size | 4 |
| Training Window | 250 |
| Functions | Add Subtract Multiply Divide Gt Lt And Or Not OffsetValue IfElseBoolean Moving Average Period Maximum PeriodMinimum AbsoluteDifference |
| Terminals | randomInteger(low=0, high=250) randomDouble(low=0, high=2) *offsetValueFixed(SP500.m250.1 0) *offsetValueFixed(SP500_VOL.m250.1 0) |
| Training Step | 1 |
| Signals before trade | 1 |
| Elitist | true |
*These are the 250-day moving average normalized predictor values (where value = current value / 250-day moving average). ** These terminals represent the latest close and volume values. These terminals could alternatively be discovered by the corresponding functions (and almost certainly would), but I believe it makes sense to include these as they are important and frequently used metrics in quantitative analysis.
The results of the five experiments are display in the following table:
|
Testing Annualized % gain |
Prediction Annualized % gain |
Annualized % gain Versus Benchmark |
|
| Model 1 |
10.76% |
9.21% |
-4.97% |
| Model 2 |
12.24% |
12.11% |
-2.07% |
| Model 3 |
11.79% |
9.28% |
-4.90% |
| Model 4 |
11.55% |
12.05% |
-2.13% |
| Model 5 |
11.50% |
9.56% |
-4.62% |
| S&P 500 Index |
3.43% |
14.185 |
N/A |
None of the models bested the benchmark S&P 500 index over the prediction period. Note that the prediction period gains generally match the testing gains for the GP models. The target index did extremely well during the prediction period compared to the testing period.
The next chart shows the performance of the best testing program found in each of the 5 models over the testing period.
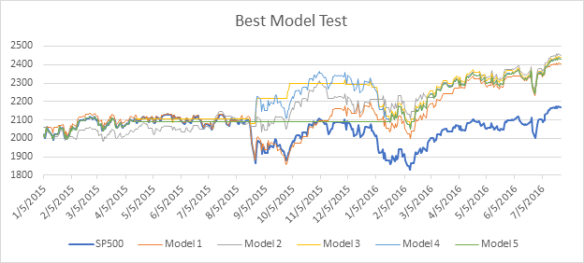
The next chart below shows prediction performance. While none of the five models beat the index over that period, the best performing testing model (#2) also did better than the other models in the prediction period, indicating this model may have some predictive value worthy of further analysis. I’ve attached the best performing testing and prediction programs found in the five models. In a future post, I may analyze these programs further, as it is not always obvious what they are doing from a glance.

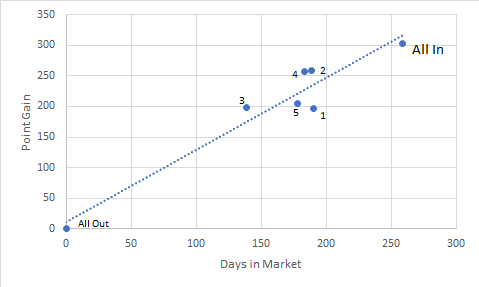
The next table looks at the number of days in and out of the market versus overall return.
|
|
Days in Market |
% in Market |
Point Gain |
% Gain vs. Benchmark |
Point gain per day in |
|
Model 1 |
190 |
73.36% |
197.07 |
64.96% |
1.04 |
|
Model 2 |
189 |
72.97% |
259.06 |
85.40% |
1.37 |
|
Model 3 |
139 |
53.67% |
198.54 |
65.45% |
1.43 |
|
Model 4 |
183 |
70.66% |
257.77 |
84.97% |
1.41 |
|
Model 5 |
178 |
68.73% |
204.53 |
67.42% |
1.15 |
|
S&P 500 Index |
259 |
N/A |
303.36 |
N/A |
1.17 |
There appears to be a linear relationship between days in and overall gain. This is somewhat expected in a rising market situation like this where the only investment choice is being long or flat. Note that three of the models, even the poorly performing model 3, achieved a higher return compared to the benchmark per day invested. This result is summarized in the final column, which shows three out of 5 models beating the benchmark on return per day invested. This is show in the chart as these three models are above the trend line.
In this experiment, I had little basis for most of the parameters chosen, other than my belief that these would be a good starting point. A further study of parameter optimization is needed to determine how the overall model performance changes as each parameter varies. It is best to modify a single parameter at a time and see where improvements level off as the value changes.
I also only looked at the two most popular predictors: past price and volume. It is likely that other possible predictors, such as interest rates, may the better indicators during certain times. Additionally, we can include short selling in the mix, partial investments, or multiple investment instruments, as one would do with a real-world portfolio.
When elaborating on this model, it is important to avoid continually modifying the parameters until we find a set that performs well on the target prediction period (i.e. data snooping). Final prediction must always be done on data not yet seen.
This experiment was only the first of many steps needed to find profitable prediction models. In the next several blog entries, I will study how changing model parameters can affect performance and hopefully improve on this experiment.
Of course, it is possible that we can’t do much better than the results achieved, assuming the returns over the target period were essentially random. This is somewhat indicated by the fact that the relative performance achieved is in close proportion to the percentage of time invested.
